


LiFePO4 (Lithium Iron Phosphate) batteries have emerged as a popular choice in various applications due to their high energy density, long cycle life, and enhanced safety features compared to traditional lithium-ion batteries. Understanding the behavior of LiFePO4 batteries is crucial for optimizing their performance and ensuring their longevity. One essential aspect of this understanding is interpreting LiFePO4 voltage charts, which provide valuable insights into the battery’s state and behavior throughout its charge and discharge cycles.
Understanding LiFePO4 Batteries
LiFePO4 batteries utilize lithium iron phosphate as the cathode material, offering several advantages over other types of lithium-ion batteries. These advantages include high thermal stability, minimal risk of thermal runaway, and improved tolerance to overcharging and over-discharging. LiFePO4 batteries find applications in electric vehicles, renewable energy storage systems, portable electronics, and more.
Voltage Basics
Voltage is a measure of electric potential difference between two points in a circuit, indicating the force that drives electric current. In the context of batteries, voltage represents the energy stored within the battery and influences its performance. Monitoring voltage is essential for assessing the state of charge, determining the remaining capacity, and preventing over-discharge or overcharging, which can lead to damage or reduced lifespan.
LiFePO4 Voltage Characteristics
LiFePO4 batteries exhibit distinct voltage characteristics during charging and discharging cycles. The nominal voltage of a fully charged LiFePO4 cell is typically around 3.2 to 3.3 volts. The discharge voltage curve depicts the gradual decrease in voltage as the battery discharges, while the charge voltage curve illustrates the voltage increase during charging. Understanding these curves helps in determining the state of charge and setting appropriate voltage thresholds for charging and discharging.
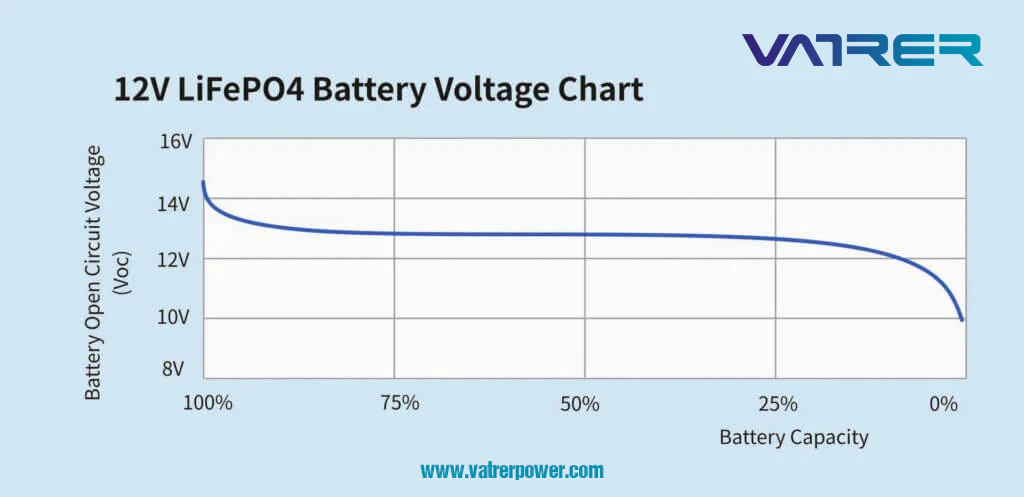
Interpreting LiFePO4 Voltage Charts
LiFePO4 voltage charts display voltage against time or state of charge, providing valuable information about the battery’s performance and behavior. Interpreting these charts involves understanding the x-axis and y-axis, distinguishing between charge and discharge curves, identifying safe operating voltage ranges, and recognizing voltage drop under load. Proper interpretation of voltage charts allows for effective battery management and optimization of performance.
Factors Affecting LiFePO4 Voltage
Several factors can influence the voltage behavior of LiFePO4 batteries, including temperature, state of charge, aging effects, and internal resistance. Temperature variations can affect voltage stability, with higher temperatures leading to increased voltage drop during discharge. State of charge influences the shape of voltage curves, with voltage decreasing as the battery discharges and increasing during charging. Aging effects and internal resistance contribute to voltage degradation over time, affecting the battery’s overall performance. To understand the behavior of LiFePO4 batteries, it’s essential to interpret the LiFePO4 Voltage chart accurately.
Practical Applications and Examples
Voltage charts play a crucial role in battery management, guiding decisions related to charging, discharging, and maintenance. Real-world scenarios demonstrate how voltage charts help in monitoring battery health, detecting abnormalities, and optimizing performance. Case studies highlight the importance of voltage chart analysis in identifying trends, diagnosing issues, and improving operational efficiency in various applications.
Safety Considerations
Safety is paramount when dealing with LiFePO4 batteries, and voltage monitoring is integral to ensuring safe operation. Overvoltage and undervoltage protection mechanisms safeguard against excessive charging or discharging, which can lead to thermal runaway or cell damage. Proper voltage monitoring and protection measures mitigate risks associated with voltage fluctuations, enhancing battery safety and reliability.
Tips for Maximizing Battery Performance
To maximize the performance and lifespan of LiFePO4 batteries, it is essential to follow best practices for charging, discharging, and maintenance. Proper charging techniques, such as using compatible chargers and avoiding overcharging, help preserve battery health. Temperature management, including maintaining operating temperatures within recommended limits, prevents voltage fluctuations and prolongs battery life. Regular monitoring and maintenance, including periodic voltage checks and capacity assessments, ensure optimal performance and reliability over the battery’s lifespan.
Conclusion
Interpreting LiFePO4 voltage charts is critical for understanding battery behavior, optimizing performance, and ensuring safety in various applications. By gaining insights into voltage characteristics, factors influencing voltage behavior, and practical applications of voltage charts, users can effectively manage LiFePO4 batteries to achieve maximum performance and longevity. With continued advancements in battery technology and voltage monitoring techniques, understanding LiFePO4 voltage charts remains essential for harnessing the full potential of these versatile energy storage solutions.